How ROI Is Calculated
The return multiple: how many times your first payout can pay back the cost of the plan.
This metric is a Return Multiple rather than a traditional ROI percentage. It’s a normalized way to compare the potential of different prop firm plans on equal footing.
Updated: July 15, 2026
Prop firms are not banks. Traders should not leave large amounts of capital in a single account. Pay yourself.
Important notes
- This metric should only be used when comparing prop firm plans of the same size and type.
- The best comparisons are Direct to Funded plans, since all firms offering them provide a listed maximum payout.
- Net Payout (Max First Payout × Profit Split) is capped per account size (see table below) to normalize outliers.
- This calculation uses the first payout only. Receiving more than one payout from a single account is difficult and only a small number of traders achieve it with any regularity. The advertised max total pay per account isn’t guaranteed either. Firms are moving traders to live accounts at a quicker pace in 2026, so the first payout is the most meaningful figure to benchmark against.
Formula
- Net Payout: Max First Payout × Profit Split. This is the actual dollars a trader receives on the first payout, capped per account size (see below).
- Max First Payout: The maximum amount available on the first payout, as advertised by the firm.
- Profit Split: The trader’s share of that payout.
- Plan Price: The upfront all-in cost of the evaluation or direct-to-funded plan.
Net Payout caps by account size
Caps are applied to the post-split payout so plans are compared on actual dollars to the trader. Values above the cap are normalized down to the cap.
| Account size | Net Payout cap | Rationale |
|---|---|---|
| 25k | $1,250 | Above the $1,125 cluster top; below the $2,400 outlier floor |
| 50k | $2,750 | Above the $2,700 cluster top; below the $4,800 outlier floor |
| 100k | $3,250 | Above the $3,000 cluster top; below the $3,600 outlier floor |
| 150k | $4,000 | Above the $3,800 cluster top; below the $4,500 outlier floor |
Example
How the caps were derived
Net Payout values tend to cluster at specific dollar ranges within each account size. The cap for each size is set to normalize plans advertising materially larger payouts so they can be compared on equal footing with the core cluster. Worth noting: nearly every plan that ends up above the cap has a rule restricting the first payout request to 50% of accumulated profits before the split is applied, making the advertised max structurally harder to reach. The table below shows how the cap sits in the distribution for each size.
| Size | Median payout | Cap | Outlier floor | Max payout | % capped |
|---|---|---|---|---|---|
| 25k | $1,000 | $1,250 | $2,400 | $2,400 | 4% |
| 50k | $1,600 | $2,750 | $4,800 | $4,800 | 3% |
| 100k | $2,250 | $3,250 | $3,600 | $4,800 | 7% |
| 150k | $2,700 | $4,000 | $4,500 | $4,500 | 11% |
Scroll the table horizontally on mobile to see all columns.
Median payout = typical Net Payout at that size. Outlier floor = where the natural gap appears in the distribution; anything above is treated as marketing.
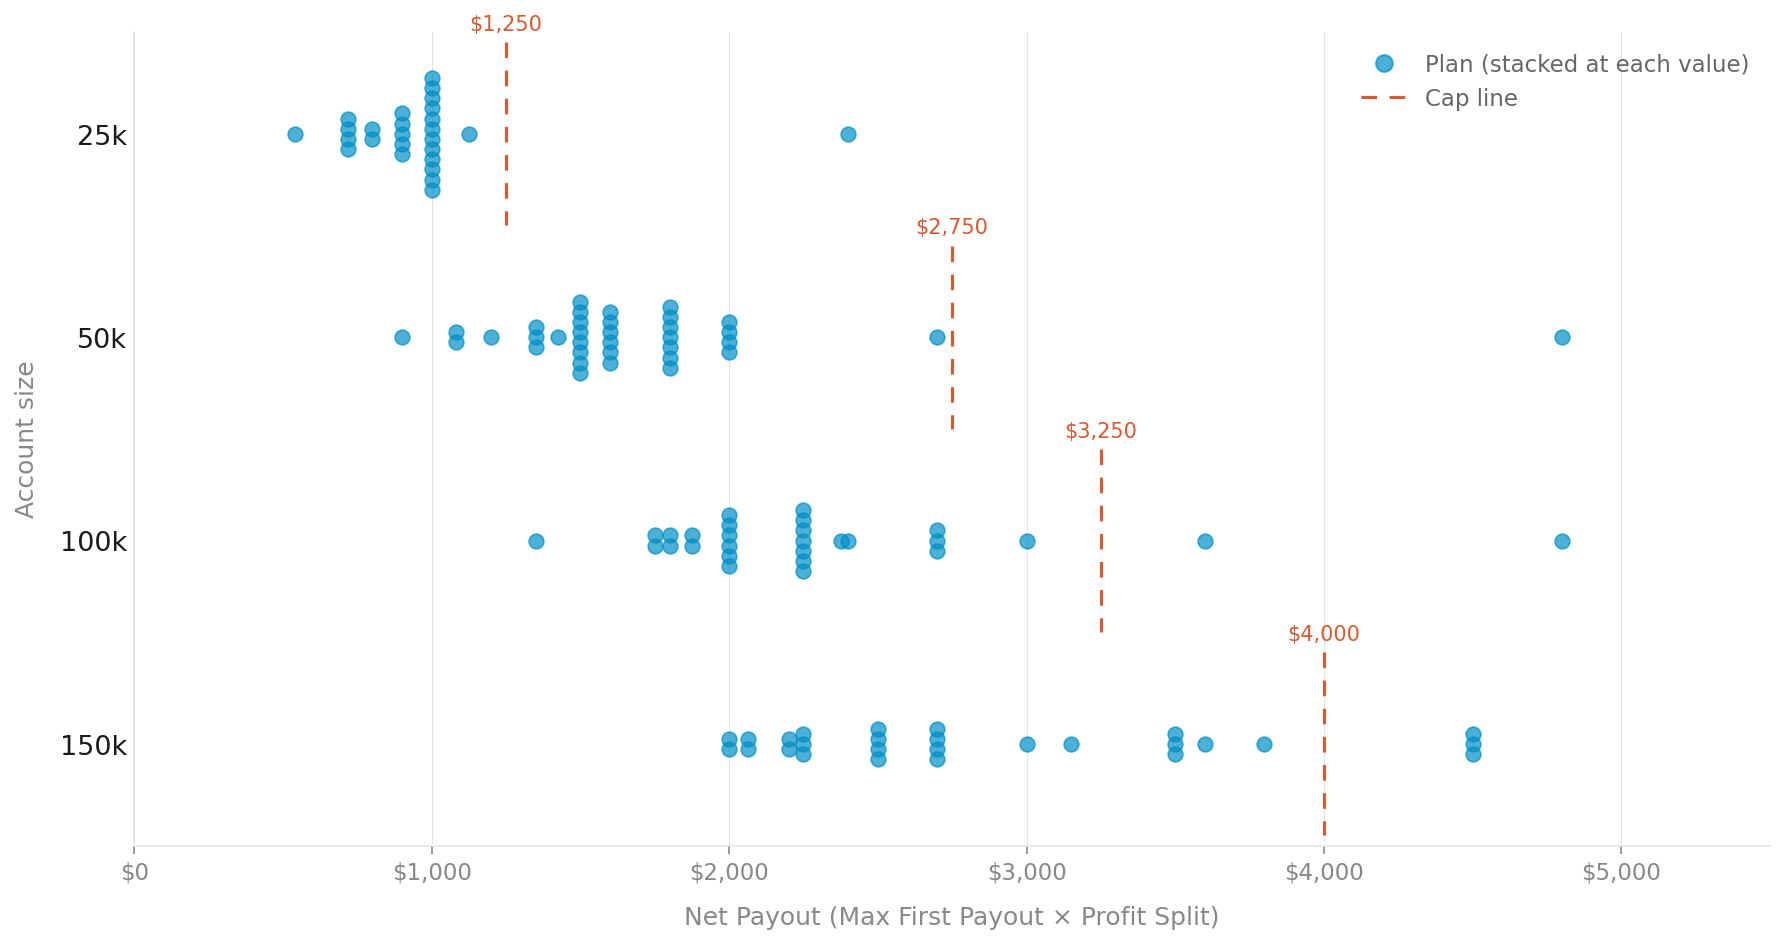
Visualized: Net Payout by Account Size
Each dot is one prop firm plan. Dots are stacked at their exact Net Payout value so you can see the clustering at a glance. The dashed line for each row marks that size’s cap. Plans to the right of it are normalized down.
Click image to enlarge
×
The cap for each size normalizes plans advertising materially larger payouts so the core cluster can be compared on equal footing.